Wednesday 22 February
Meeting page: https://www.jisc.ac.uk/events/ninth-uk-learning-analytics-network-meeting-22-feb-2017
Periscope feeds: https://www.periscope.tv/w/a3wJ2DF6WUtiR052b0FsamV8MUJkR1lQYlJFRXlLWAqY_QISkHdJ-vVGenroISXQhMsriMAaIFCPvBooUQvY
https://www.periscope.tv/shrifootring/1lPKqZWdryWGb?
These notes are my own thoughts / quotes from slides and presenters and not meant as a full record of the meeting. I’m happy for people to correct me / remind me of areas I’ve missed off. Please excuse all spelling and grammatical mistakes.
Learning analytics at Exeter
Speakers: Professor Wendy Robinson, academic dean for students, University of Exeter, and colleagues
Worked with Tribal to provide feedback on their development of a staff dashboard.
Effective Analytics – not predictive analytics – important distinction.
Focus is on success – not risk of failure or drop out.
Soft launch with students.
Good student feedback.
Next steps – considering interventions and what they might look like.
—
Jo Smith:
Mature and BME students have a higher dropout rate in the EU.
Some universities have a dropout rate as high as 43%
Despite increase in popularity, few LA programs are empirically and ethically tested.
Static vs dynamic variables – dynamic / live / near live data adds additional value to the data and better analytics.
Found studies that showed post-intervention LA had increases in grades / course activity.
Results on student withdrawal rates varied.
3 key factors in predicting student success:
- Social / demographic fac
- Academic history
- Engagement, usually in VLE
- How to measure engagement
- Does engagement predict success
- How to identify students who need extra support
Can identify students who need more support based on demographic but the decision tree might also allow for other identifiers.
Can changes in behaviour be an indicator of required support?
Now looking at what sort of analysis could be used to spot change.
By putting these metrics on a dashboard students will assume that engagement in that metric will equate to success in the course – are we sure it will? “Knowledge is power” vs “first do no harm”
Jo Smith:
Survey undertaking at Exeter:
Does the data we have really give good insight to the student experience?
Running survey to gather student perceptions of their engagement with their course.
>200 students recruited. Get a survey each week. Will match returns with data already held by university.
Data collection is ongoing over the rest of the academic year.
Update on Jisc’s learning analytics programme
Speakers:
Paul Bailey, senior co-design manager, Jisc
Michael Webb, director of technology and analytics, Jisc
Rob Wyn Jones, senior data and analytics integrator, Jisc
Paul:
Looking to launch live service from september 2017
Join JISC maillist: analytics@jiscmail.ac.uk
Blog: analytics.jiscinvolve.org
Next meeting at strathclyde university.
Webinar 27th Feb – next Monday on accessibility and LA. www.jisc.ac.uk/events
Updated architecture – [need to get copy from slides later]
Consent at present only relates to self declared data but could be worked on to widen the scope.
Further announcements due out soon on other suppliers working with JISC on this project.
Rob:
Lot of working going on with the learning records warehouse and data feeds being clean.
Working on VLE data extraction. Getting over the problems and also try to plug in to assessment data – e.g. Turnitin.
Piloting attendance tracking now.
Presenting at digifest on attendance monitoring.
Study Goal app v1.0 on iOS and android for pilot – contact JISC for access.
Developed a quick way to validate data as it comes in – UDD Validator Tool.
Built in field-level AES encryption, with output to JSON files (LRW load ready)
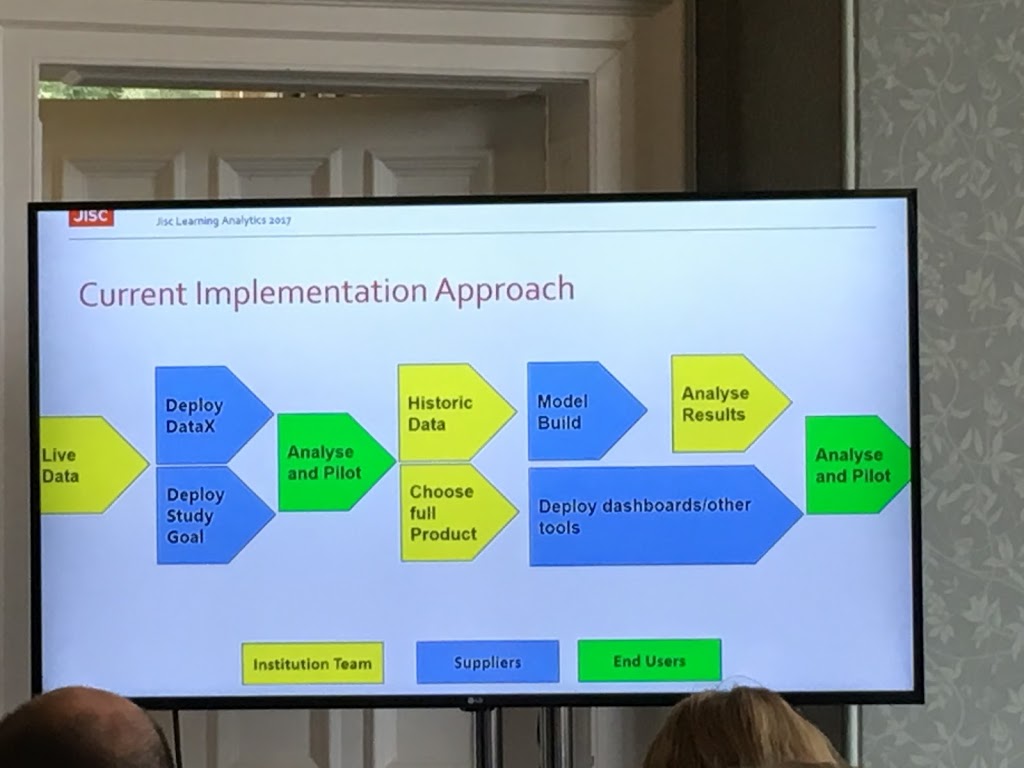
Paul:
Updated onboarding model based on experience.

First Analyse and Pilot point can usually highlight where HEI doesn’t have the data needed (or at least in the format / location needed).
Developed a tool – Data Explorer. Sits on top of the data warehouse. Not a long term tool – just to help understand data and visualise it as we develop.
Paul demonstrated screen from the tool showing how data can be visualised using the tool.
e.g. as a tutor you can see your tutees, see each tutees activity over time, General indicators (e.g. days since last activity, grades etc.), risk level indicators.
Updated daily.
Will be releasing new visualisations as they go along and work with institutions.
Now have a module visualisation – i.e. all students on that module grouped together and also ranking students vs activity.
Measuring learning gain: big data, learning analytics, tests and surveys
Speaker: Dr Camille B. Kandiko Howson, senior lecturer in higher education and academic head of student engagement, King’s College London
Learning analytics has multiple interpretations and intended usages.
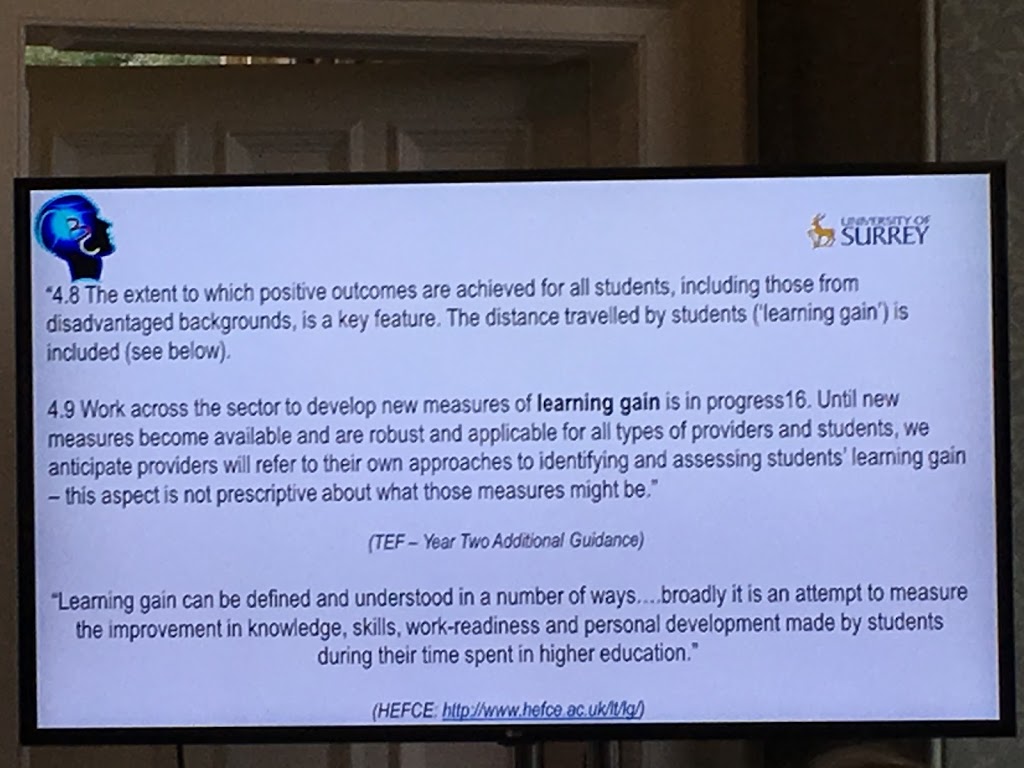
TEF really wants to look at student outcomes and student gain but we need the data and metrics to do this.
Discussions are around better metrics to look at student gain whilst in HE.
HEFCE funded 13 learning gain pilot projects looking at:
- Learner analytics / grades
- Self-reported surveys
- Standardised tests
- Multiple measures of a specific theme
Studies are looking at Employability skills, some are looking at career sustainability and career adaptability.
But this all comes back to “What do you think the point of HE is?” is it to get a job?
What metrics do we think are important? They shouldn’t all be the same, we need to look at these at an institutional, faculty, course, module and student level.
How do students want to use / want us to use the data we are collecting?
Could a student take a HEI to court for failing to act on the data they are collecting if it showed a student was failing and the HEI did not act on this?
Learning analytics and learning gain: the experience at Oxford Brookes
Speaker: Dr Ian Scott, associate dean student experience, Oxford Brookes University
Have a very open approach to student data.
Current retention rate: 93.4%
Good degrees: 75%
Building a system around student success, not retention. Not looking for prediction. No additional interventions. Supply the data to the students about their own study behaviours and achievements – referenced to ‘what good students do’. Some or all of the data shared with tutors (student choice). Data used by University for broader behaviours.
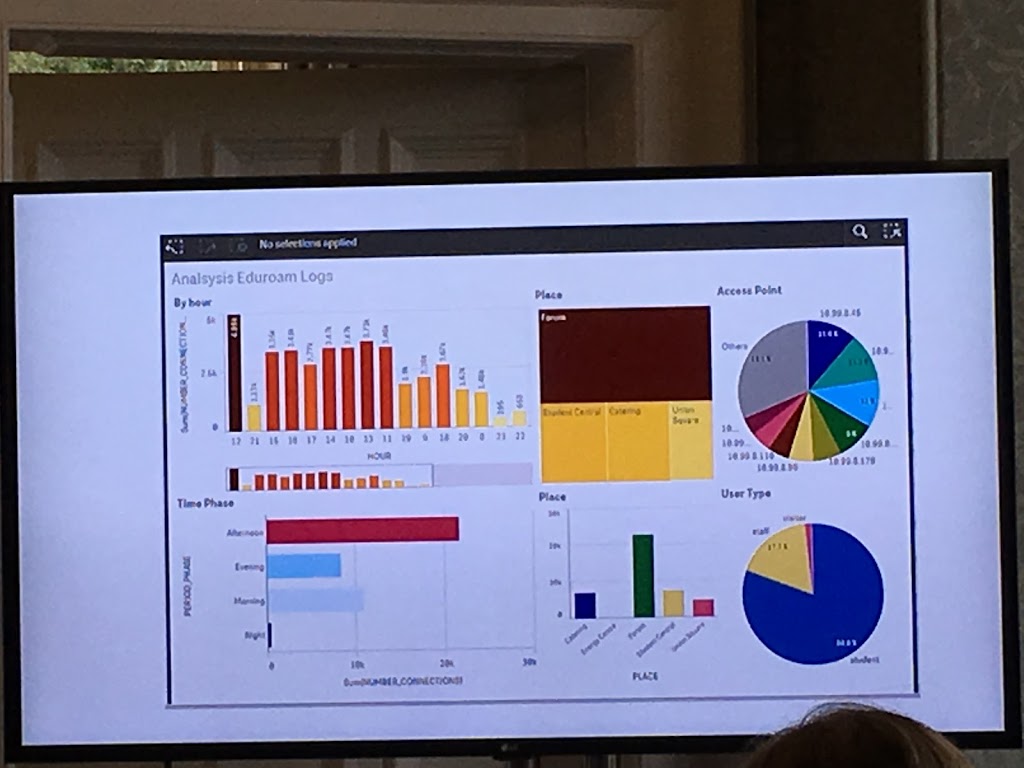 |
| Eduroam data, shows more activity in afternoons (bottom left) |
If HEI’s really wanted to focus on student experience they wouldn’t start to teach until about 11:00 each day.
Looking at downloads by student from library < 10Mb > to differentiate resources and films.
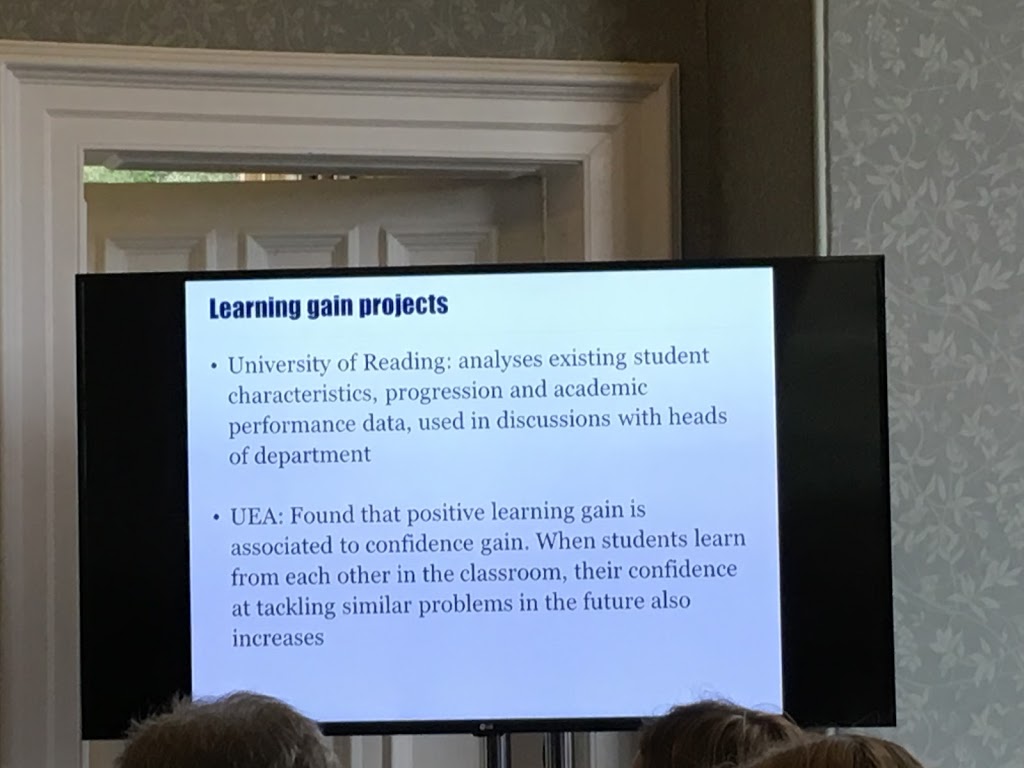
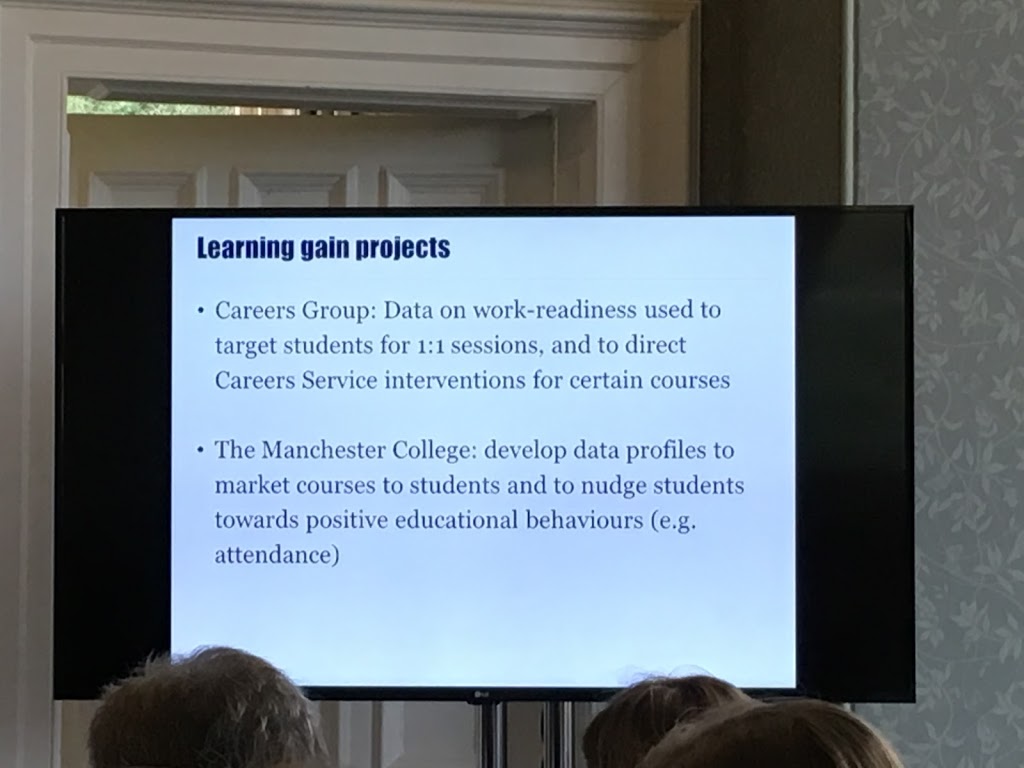
Learning gain project:
Big challenge: legal and technical issues with sharing data with other HEIs.

Undertook a literature review on learning gain.
How can you measure learning gain?
e.g. Raw gain, true gain, etc.
The grading conundrum: a B in the first year is not the same as a B in the second year.
Just looking at grades you can not say that there has been a negative learning gain, unless perhaps if you look within a module.
They found in social sciences – good students improved learning gain more as they progressed and those who weren’t so good at the start went down in learning gain as they progressed.
In Science they found good student maintained learning gain and poor students improved.
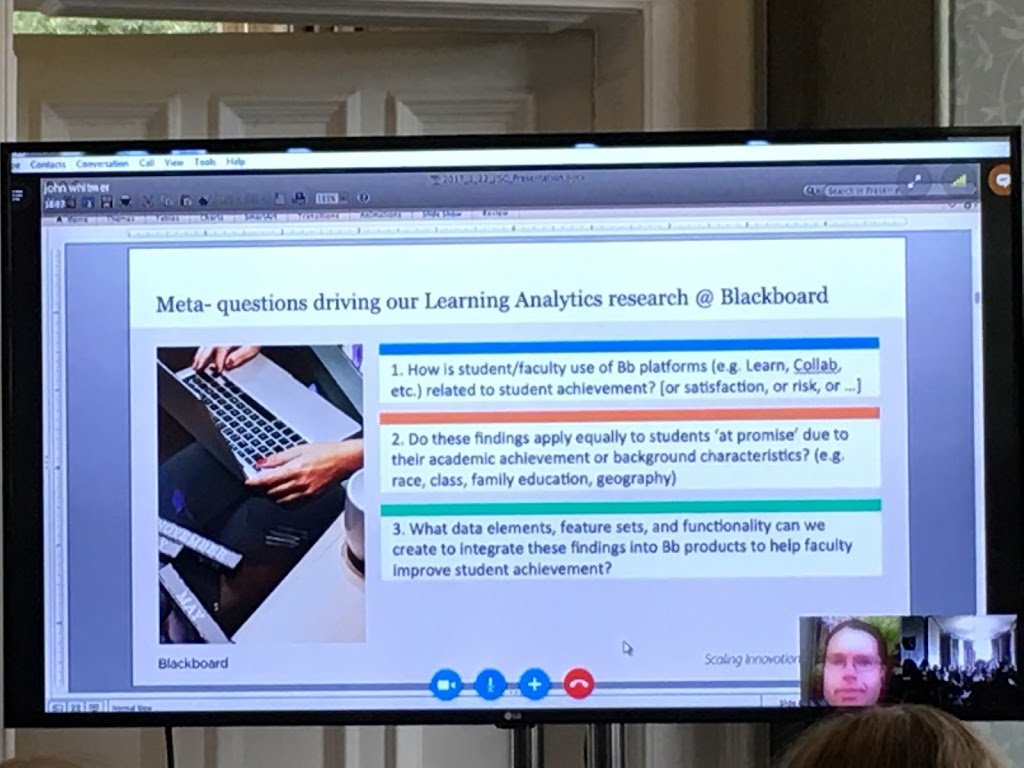
Blackboard research into learning analytics
Speaker: John Whitmer, director of analytics, Blackboard
Main data sources and Techniques
Key data sources:
- Learn Managed Hosting
- Learn SaaS
- Collaborate Ultra
- Simulation
- Hypothesis Testing
- Data Mining
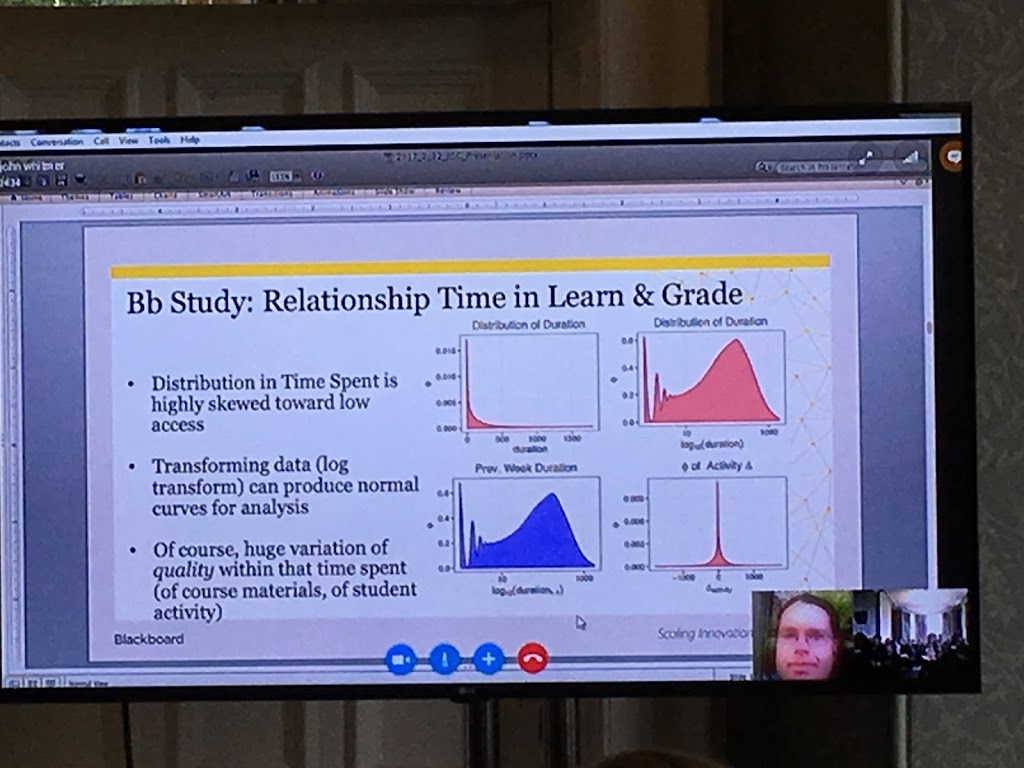
Found very little occurrences of students opening tabs and then going off to do something else. these can be filtered out as students usually interact in short bursts of activity.
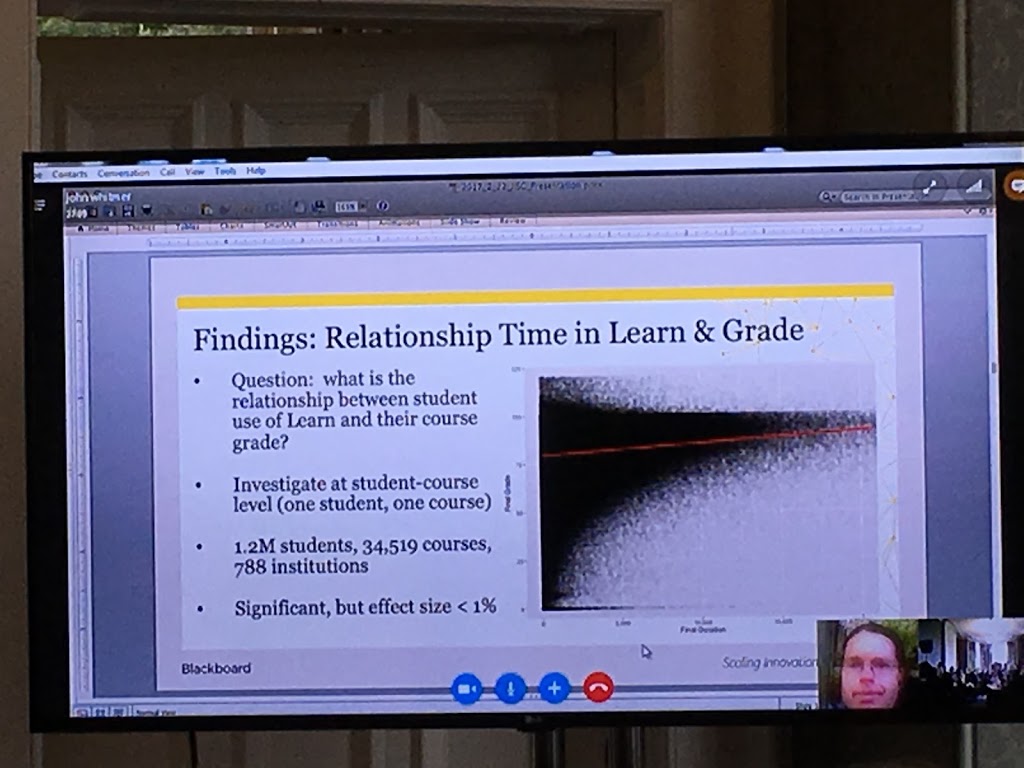
Showed low benefit for additional activity in course when looking at 1million students together.
You break this down and you start to find a better trend on some students. Their early activity in the course can have a big impact on their outcome.
In some courses they could show that 20-22% of student grades could be explained by activity in VLE.
Learn tool use vs grade
Looked at specific tools and their usage against grades.
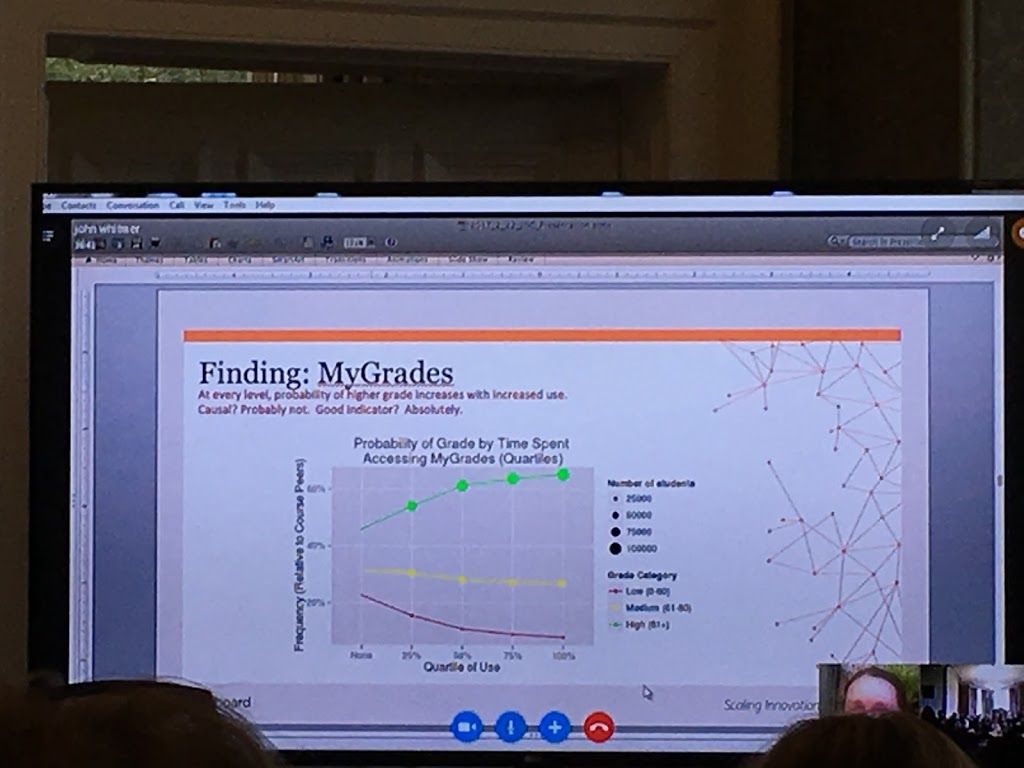
Those students looking at their grades more usually achieve better.
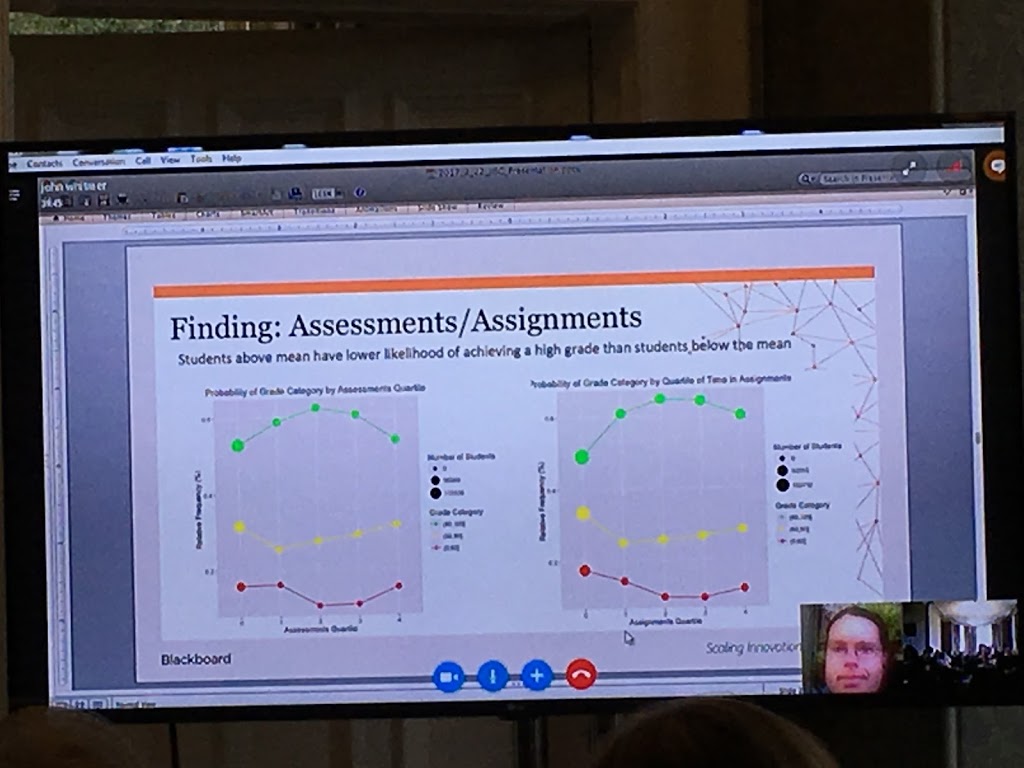
Students above mean have a lower likelihood of achieving a high grade than students below the mean
Move beyond VLE use as a proxy for effort.
The more engaging / holistic use of VLE = more time students will spend in course.
[For details I’ll need to link to slides when they’re published.]
Be First to Comment