The following are my notes and thoughts from this event. Please feel free to comment pointing out errors or suggested additions. I will try and clean them up post-event.
After an interesting pre-conference workshop yesterday, I’m looking forward to Malcolm’s warm welcome and a new setting this year (for me – last here in 2007) at the Durham Business school.
Welcome from Tony Fawcett – Dean & Deputy (PVC Education) – Vice Chancellor’s Office Durham University. Interesting to consider the difference in topics planned for this year vs the first conference 16 years ago.
Welcome
Malcolm Murray
Failure is a learning opportunity not a judgement on who you are.
[Not sure if this was an intentional failure but Malcolm – you’re flying the Union Flag upside down!!:

]
Keynote
Why Educators Can’t Live Without Social Media
Eric Stoller
Educational Consultant
[Another Union Flag fail:
 ]
]Social media conversations are the fastest way to work out the cultural environment of an organisation.
@Jack “Twitter is the most powerful communications tool of our time. It shows everything the world is saying rn… 10-15 minutes before anything else.”
People now turn to twitter to find out what is happening in emergencies before they turn to news channels.
Listen & Learn – it’s ok to be on social media and not say anything. You can get a lot out of social media without having to partake in the conversation.
If your audience is on mobile devices why wouldn’t you want to go there?
In the past being asked to link on LinkedIn felt like this:

Now it’s very common to link with others and even those you don’t know.
These days it’s important to get student on LinkedIn sooner rather than later.
The student experience is holistic.
YikYak – location based anonymous social media. [I’ve been using this for a while and find it very interesting – especially when student debate missing my class]
Capturing Module Quality: An Enterprise Surveys Pilot
Chris Slack & Adam Tuncay University of Leeds
Enterprise Survey is a survey solution usually included in your blackboard package. It can be hard to get this to do what you want it to do but Leeds have managed to get it working for them.
Traditionally students at Leeds had to complete an MCQ (plus a few text fields) paper survey that was then machine read and returned to the academic.
The questions were set across the university so that if you wished to add an additional question you couldn’t.
Response rate was 40-45%.
Group were tasked with improving response rate, preferably online.
Evasys was used by some faculties – but didn’t use the online version – paper only. Expensive, labour intensive, response rate 50%. Bit better than previous company in reading the data from the paper.
VLE Test Tool
Replicated questions on the paper version into the test tool in the VLE. They did this so that they could assign a score value to help with the data output. As this was a test it wasn’t anonymous. Allowed class time to complete this. Response rate 50-55%. Ran this as a pilot for a full year. Still labour intensive.
Enterprise Survey
Included in their Bb Licence (no extra cost). Allowed them to survey every module at once. Anonymity preserved. Single automated approach to module evaluation.
Matching against requirements from initial plan Enterprise survey didn’t tick all of their requirements – missed % of total respondents per answer & Automatic % calc of results on a per question basis. It did though tick all of the others.
From the known issues at the time there were three that they considered critical. Batch ID wasn’t helpful on download – they had to change to match course ID. Start and end date wasn’t editable once the survey was created – fixed since.
Set up their Bb in a hierarchy – manually entering all of the modules into the nodes.
Found out that some of their SIS was wrong and modules were listed in the wrong term etc. This caused a lot of work and so for the pilot they didn’t use the hierarchy.
Managed by VLE team – not faculty staff. Anyone with access could chose to send any survey to anyone any they didn’t wish to allow this risk.
Chose to not delivery the survey by email. As class time was being assigned to the completion of this, they didn’t want the email going out to all at the same time when some will not know about this.
Results are released to instructors.
Moved some staff to teaching assistants but this caused an issue with Bb collaborate where only instructors get a dedicated teaching room.
Response rate moved up to 57% (UG 48% PG 74%) in Sem2 14/15 and 65% in Sem1 15/16
In Sem1 15/16 their reduced the questions from 20+ to 10 plus a couple of textual questions which the school / academic could chose.
Also helped reduce admin time in the schools.
Can not and thus now do not allow academics to redact textual comments from students.
Had an issue around deployment time – deployed at 09:00 took until 09:32 to reach every student in every module. Thus some students couldn’t access when they tried at 09:00. Now publish in advance.
It is better to copy a response period than create a new one from scratch as this retains a lot of your settings and reminder emails.
Invitation is only sent to students – instructors can not therefore see that the survey has gone out.
If staff had turned on preview student and kept data before survey went out it allowed them to see the survey but also included the preview student in the data report.
Can not complete the survey via the Bb app – need to access via VLE which isn’t great on a mobile. Survey works well on a mobile once the student gets to it.
[My take away from this session is that I do not think this will work in the long run (sorry). Having only 10 questions to evaluate a module can not have depth to truly evaluate a module. I also felt that having to have the school academic independently inform the students what to answer for the two free text questions will lead to confusion and mistakes.
I do like that they have moved away from paper and embraced digital technology to save time, effort and consumables. I can see the benefit of creating some standard questions to be included in all institutional module evaluations but these should be in addition to module / course / school / faculty specific questions.]
Designing A Pre-Induction Course: Mistakes, Issues and Success
Steve Dawes Regent’s University London
@malkatraz
Part of a wider overhaul of the student induction process.
Needed a centralised point for information.
Streamlined real-world induction
Planning:
Focus on key information through a student centric platform
Needed single sign on of unregistered students.
Created a prototype and reviewed through student support. Comms team reviewed style and context.
After prototype asked VLE vs Intranet – realised were using VLE as a website. Changed pre-induction information to pre-induction COURSE to include interactive use of tools in VLE.
When a student first accessed the VLE they have only one module – the pre-induction.
Used learning modules to house content in the VLE. Clean simple design.
[Reference to not having to scroll to see content on pages – not valid depending on the size of screen the user is accessing from.]
At key points in journey through content user was presented with a test checklist which provided additional information in the feedback spaces when required.
Provided links to social media.
Had good student uptake. Positive feedback from stakeholders. Decreased student FAQs to central services.
Planning to run face to face sessions, improve media content, link to group inductions.
[Personally I felt that more signposting / a quick access guide on how to access the VLE might have been needed to support some of the students. Having them all share a single username and password limits evaluation and tracking of usage and uptake. I liked the layout of the course and the style chosen keeping it clean. I will be looking at setting up a test with instant feedback in the future too.]
Growing Pains: Preparing For A Teenage VLE
Andy White University of Cumbria
When they started to look at a VLE it was to support the multiple campus based university.
in 2003 they were posing out VHS tapes of lectures and were running into file size issues and dial up modems.
By 2007 started to use the system more. Some of this extra traffic was driven by the departments having to pay for all handout printing they were doing.
By 2009 lot more usage but as staff were not being pulled in from SITS they had to deal with first paper then digital requests to enrol staff on their modules.
By 2012 all programmes had to have an area on their VLE.
By 2014 they had a report suggesting they consider Bb as mission critical.
2015 undertook a benchmarking exercise.
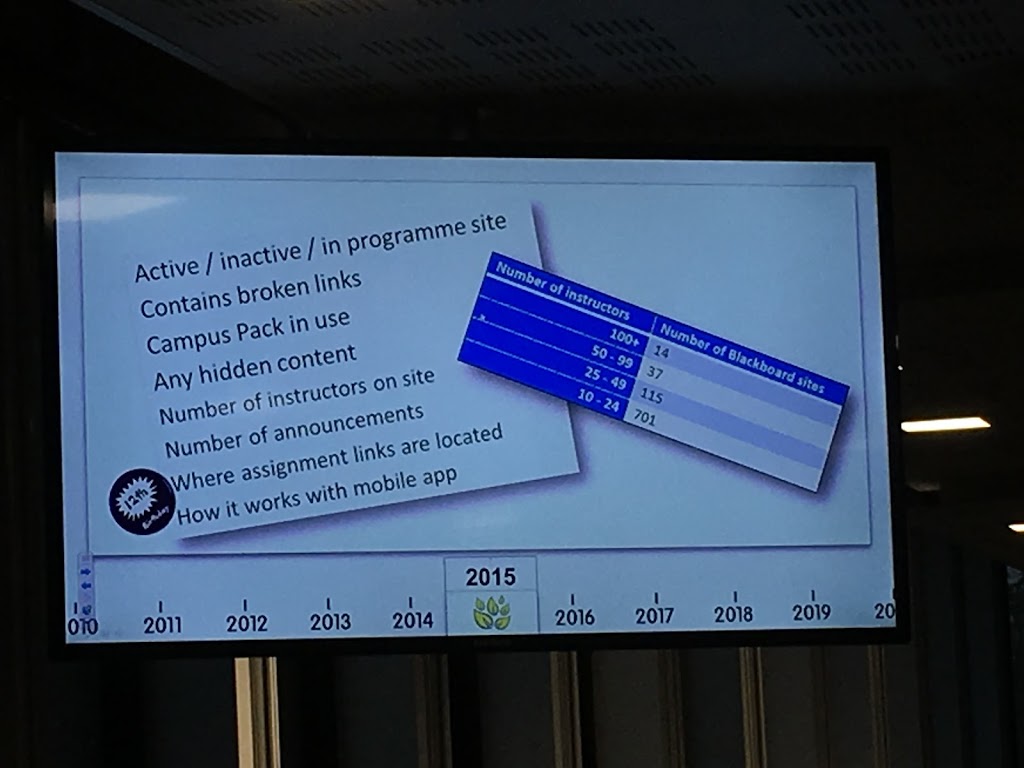
50% of modules checked didn’t have active Bb sites. 40% of the active sites didn’t have any announcements on them. Many of the modules were not mobile friendly.
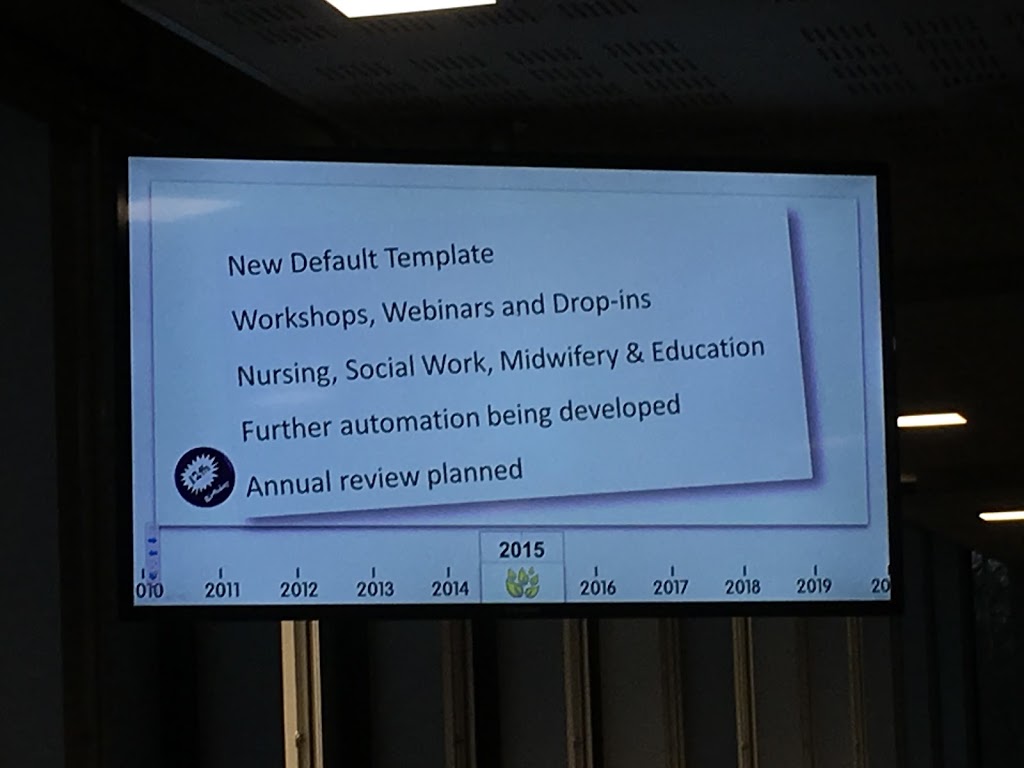
Also planning to undertake another benchmarking.
Had some monster sites for Programmes that had 100+ staff in. Worked with them to develop better templates and break the content out to module areas.
Staff were worried how students would find the content but they were looking at their long course list and not understanding that the students had a greatly smaller course list and it was simpler for them to access.
Marks Integration and the Digital University: Our Experience of Using Blackboard’s Grade Journey
Jim Emery Glasgow Caledonian University
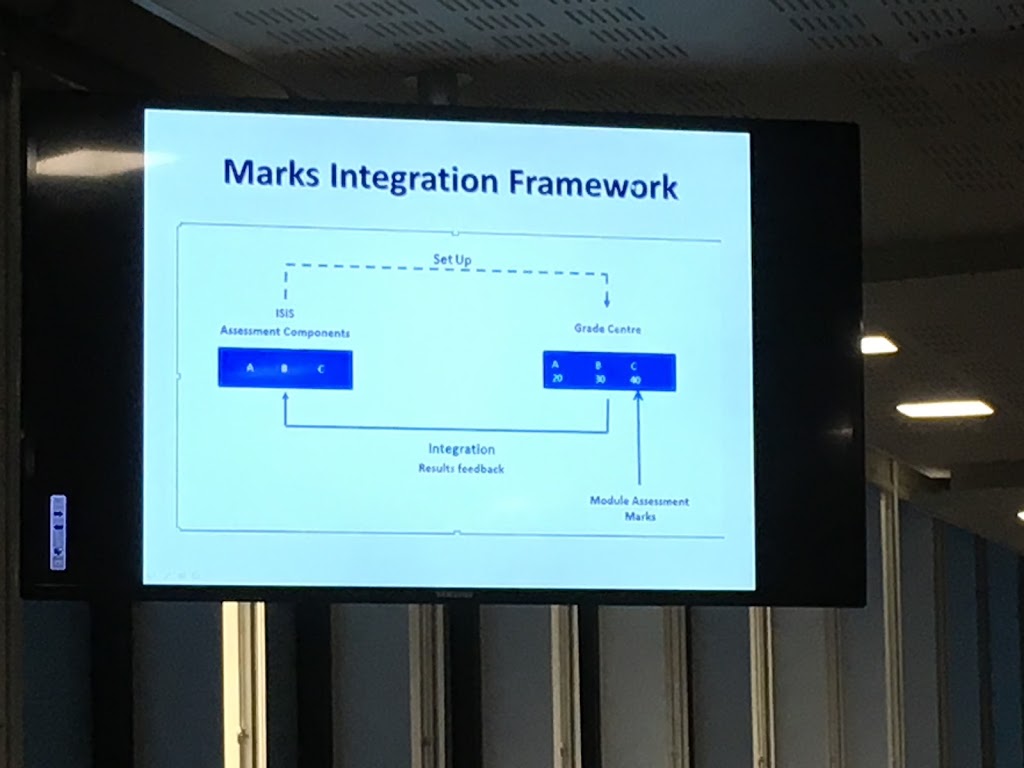
VLE space setup from Student Information System – Grades into VLE – Grades into SIS in correct fields.
Drivers for integration:
Student satisfaction
Staff satisfaction
Wider Efficiencies agenda
PWC Audit
Demonstration of how their system works.
When you edit a column in the grade centre you get and extra section of options to allow you to map the column into the SIS. This seems like a lot of work, but should reduce the workload on staff overall.
Now getting staff to input grades from written exams into grade centre – either directly or via the offline mode excel file.
There is now also a grade approval and transfer tool in the grade centre that allows for the transfer back to the SIS. THIS THEN LOCKS THE GRADE CENTRE – so can only be done at the end of a module.
[When considering this for analytics we’ll need to pull grades from Grade centre live and then look back on grades from SIS later]
How do you handle resits?
(Manual entry?)
DAY 2
Learning From Failure: The Blackboard Perspective
Alan Masson
Head of International Customer Success, Blackboard Inc
Reflections on a shared journey – What lessons have we learned along the way?
Opening with a talk about Bb’s journey.
“Bb is now enabling the wider organisation”
“We must continue to innovate and consolidate……”
Establishing e-Learning –> Enhancing practice –> Supporting innovation
Mission Critical — Robust and Reliable Infrastructure
University of Manchester are starting to do some essay based exams on PCs – but IT needs to keep up and evolve with these demands.
[Trying to sell managed Bb solution to allow IT to sleep better – our self hosted service has had excellent service and we have better control]
Summation of several minutes – we need to better integrate data sources and tools providing a single portal whilst becoming more efficient.
If staff are confident that the system is going to be there when you need it they are going to better engage with it.
Need Evidence-based decision-making and a continuous cycle of improvement.
Another reminder that Bb are producing Grades Journey
Quick reassurance about the new CEO.
Audience asked – What failure has Bb learnt from the most – Answer – communications failure.
A Student Centred Approach to Analytics at the University of Edinburgh
Josephine Kinsley, Wilma Alexander, Ross Ward & Miles Blaney
University of Edinburgh
In 2013 there was demand from the schools, personal tutors and a student experience project to look at analytics.
Undertook a review to see what staff and students wanted, what was available and what other HEIs were doing / using.
Undertook a literature review.
Looked at the tools to work with the Bb Learn data.
Looked at student stories (I want to be able to do…) and found that out of 94, 35 could already be done using existing tools.
Feedback Sessions:

Started to design and build. Chose to use a data warehouse so that they were not doing any work against their live servers. Data pushed out to warehouse every 24 hours.
Students wanted to be able to see their progress vs the course average.
Graphical display.
Used building block to allow staff to include their course in the project.
Students got a heat map view of their activity in a course.
Bb Learn gradable items were only included (Turnitin thus wasn’t). Only imported numerical values (worked on %)
Column chart displayed student grade alongside course average grade.
Instructor can see graph for each student.
Well evaluated by students
Willing to share the Building Block they created. Will keep it maintained to the version of Bb they are using.
Planning to sign up to a data mining company to see if they can find some groupings and patterns.
Electronic Submission on Large and Complex Courses
Chris Boon City College Norwich
Created large Bb course and then used Groups to separate out students on the different pathways.
Used categories and SmartView to handle GradeCentre.
Be First to Comment