The following is my live blog of my notes and thoughts from this session. Please feel free to comment and suggest changes / things I’ve missed. I’ll correct later I’m sure 😉
Building Institutional Readiness For Learning Analytics Workshop
Date: Wednesday 6 January 2016
Time: 2-5pm
http://community.dur.ac.uk/lt.team/conference/?p=1112
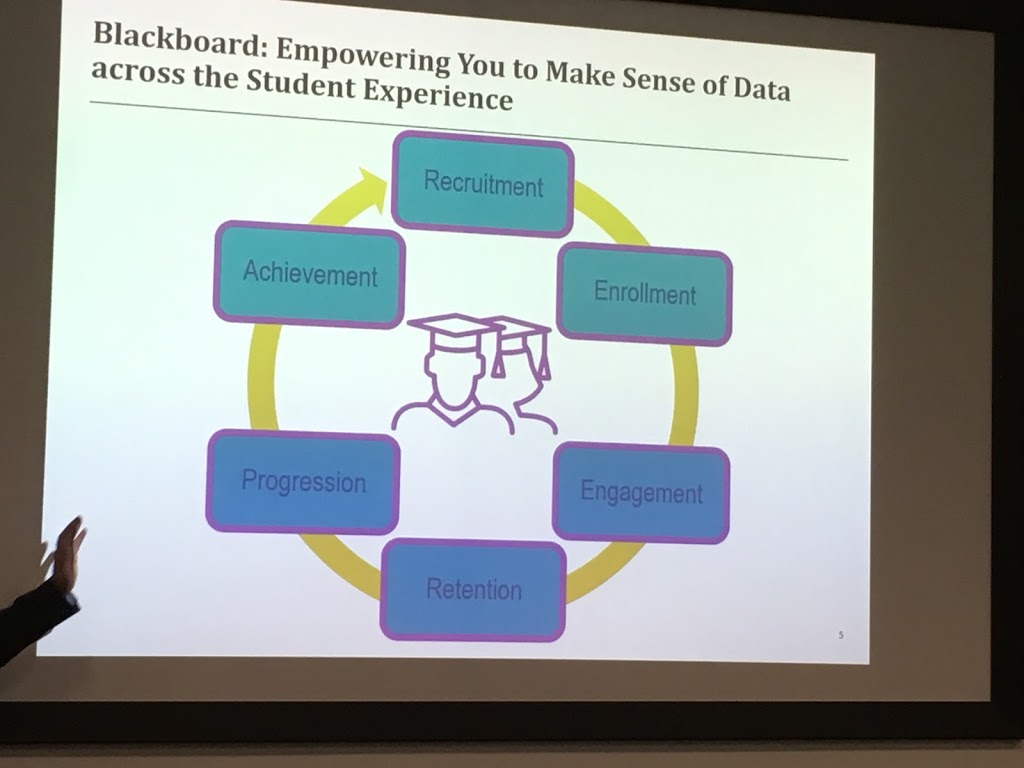
Top priority of most universities is going to be / is already retaining students. Followed by attainment then on to costs and recruitment.

[sorry lost connection and update failed]
BIRT – open source system based on Eclipse.
Shown example of assignment feedback cycle (how long it takes an academic to mark and return feedback on assignment).
This could be used to see if this has an impact on the retention of students.
Blackboard does provide you with a schema so you can access all of the data in the BB database
BB retention Centre:

last login – activity – grades – missed deadlines are a good indicator of students at risk.
Not attempting a formative assessment is a really early indicator of a student who may be at risk.
Limitation of retention centre: used by academic within their own course. Doesn’t attack programmes and can not automatically refer a student to the correct support network / channel.
BB’s approach – Pre-Built Data Integration. SIS – Bb Learn – Other => Transformation based on local rules => Data Warehouse => Pre-Built reports
Data Warehouse will allow Context – Comparison – Correlation of Course Activity and Grade data.
Data collected nightly.
Over time allows longitudinal study.
Now being shown a data model demonstrating the dimensions you could choose to use to generate a report.
Being shown a dashboard created by Charles Darwin Uni which pulls in data from other DB’s and Bb’s DB to give a wider view of the students.
Usual reports look at individual’s engagement vs (course / department) average.
The more data you allow to be brought into the data warehouse the better your reports become.
A report can also be created to see the programme at a glance.
Alerts could be sent to your desktop to warn you when you’ll need to look at the reports as students have breached the rules created, indicating a possible issue.
Bb have recently purchased an analytics company (bluecanary) and they will be bringing their solutions into the ones offered from Bb currently.
This will give you a highly processed highly visual output of the students on your course.
Progress on this will be announced at Bb World.
———-
Next segment
Discussed JISC commissioning (see previous blog posts on this topic blog.kelf.co.uk)

Will deliver:
1) To what degree is your institution ready for LA? (possibly with recommendations)
2) Indicative feature set and data improvement cycle
— Helps inform what a pilot might look like and what the HEI is looking for
In the future we will need to consider all new purchases of teaching software / hardware and its ability to forward data to any data warehouse solution.
[We were spotted by @AnneCross1 https://twitter.com/AnneCross1

Macs all the way!]
Interesting to see what Darby Uni are currently doing with their analytics. They are only just starting and they have a lot of warnings about being overwhelmed by some of the data. They also had an issue with modules which hadn’t started yet showing up in their data and having the possibility of a member of staff identifying a non-engaging student because the module hasn’t started.
Questions
(for richard)
Why nightly sync of data to warehouse?
Can students access their data themselves?
Who can create these reports?
Be First to Comment